Bitte aktualisieren Sie Ihren Browser zur korrekten Anzeige dieser Webseite.

Making scientific visualization more accessible to people with vision impairments

Despite the benefits visualizations can bring to understanding and communicating relevant societal issues such as climate change, they are difficult to access for one in 24 people in Switzerland who live with a visual impairment.

Therefore, this project explores the potential of Virtual Reality (VR) for inclusive knowledge transfer through the participatory design of an interactive visualization that can be discovered and experienced through haptic feedback and spatial sound.

The VR experience was designed in an interdisciplinary team consisting of individuals from computer, learning, climate science and sound design, while involving the target group of blind and visually impaired people along the way through interviews, meetings and testings. This process led to the creation of an accessible, embodied, audio-haptic infographic about the global water cycle and its links to extreme weather events.

Based on these findings, the project derived design guidelines to support the future development of inclusive visualizations using VR technology. Ultimately, these experiences can support multi-sensory, body-based learning and provide a new approach to experiencing visualizations that can be beneficial to all learners.

Helena Klein
MA-Diplome 2024

illuzation-hk.com
illuzation.hk@gmail.com
@illuzation

Mentorship: Dr. Julia Chatain and Noemi Chow

Cooperation: Dr. Julia Chatain, Senior Scientist Singapore-ETH Centre

Dr. Paul Astagneau, Institute for Atmospheric and Climate Science der ETH and WSL

Roland Gruber, Schweizerische Caritasaktion der Blinden

Edinson Nuez, Blinder Pianist und Musiklehrer

Part of Sustainability Dossier Funding Programme 2024

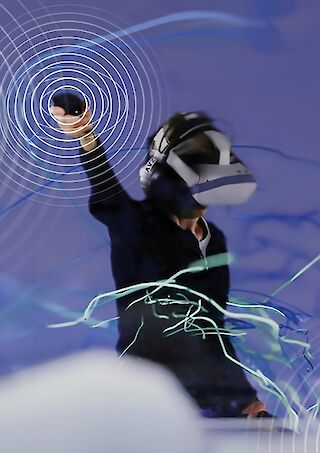
This visualization shows a participant stretching out the controller during the testing to search of virtual elements through sound and haptic feedback.
A visualization showing a blind user interacting with the virtual cloud within the VR experience and receiving multi-sensory feedback.
This collage shows the embodied interactions of each tester, captured by controller tracking and analysed based on their shape.
A collage showing the sum of all interactions per person during the test, visualized using the controller tracking data.
All interactions of one participant, visualized based on his controller tracking data, showing specific movement patterns.
A screenshot of the development process of the VR Prototype in Unity showing an above view of the virtual 3D model.
The controller tracking data, visualized with the software blender.
During a discussion with Roland Gruber after testing the first low-fidelity version.
An untextured version of the infographic combined with a sketch planning the embodied interactions.
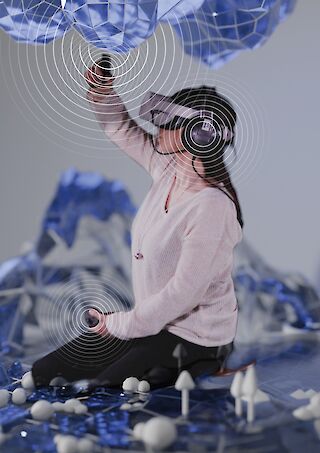
This photo shows a girl interacting with the groundwater in the virtual infographic during the final test.
A mind map showing the relevant information and where it is located in the experience.
A photo of Jonas Füllemann, Helena Klein and a blind user about to begin testing.
The final, untextured version of the infographic combined with a sketch, showing the circular interactions.